Numerical Integration
Overview, Objectives, and Key Terms
In Numerical Differentiation, finite-difference approximations were developed and used to evaluate derivatives numerically. In this lecture, we’ll explore and implement our own numerical methods for evaluation of integrals. We’ll also continue using SciPy, this time through its numerical integration tools.
Objectives
By the end of this lesson, you should be able to
Evaluate definite integrals numerically using left- and right-sided Riemann sums, the mid-point rule, and the trapezoid rule.
Evaluate integrals of sampled data using
scipy.integrate.trapezoid,scipy.integrate.simpson, andscipy.integrate.cumulative_trapezoid.Interpret how sampling choices create overestimates and missed area.
Evaluate integrals of callable functions using
scipy.integrate.quadand related functions.Establish the order of an integration scheme using numerical, graphical, or symbolic means.
Recognize how numerical integration can be used to build probability and balance checks in deterministic response models.
Key Terms
Riemann sum
left-sided Riemann sum
right-sided Riemann sum
mid-point rule
trapezoid rule
Simpson’s rule
sampled-data integration
adaptive quadrature
scipy.integrate.trapezoidscipy.integrate.simpsonscipy.integrate.cumulative_trapezoidscipy.integrate.quadscipy.integrate.dblquad\(n\)th-order approximation
Riemann Sums in Practice
For derivatives, we took a limit of a finite difference for an exact answer but stopped that limit for a sufficiently small \(\Delta\) to ensure a reasonable estimate. For the first derivative, we saw the first-order forward and backward schemes along with the second-order central difference scheme.
For integrals, we have analogs to these choices. You may remember the following formal definition for a definite integral:
Here, the sum is a Riemann sum (specifically a right-sided sum). Integrals are areas under curves, and Riemann sums approximate those areas by rectangles. Just as for derivatives, we don’t take the limit but let \(n\) be a finite number. Moreover, we have different numerical options depending on how we define the rectangles of the Riemann sum.
Let’s look at this concretely for \(f(x) = x^2\) over \(x\in[0, 1]\) with \(n=5\):
For this increasing function, the right-sided estimate has positive signed error: the estimate lies above the curve on each interval.
Notice that the height of a rectangle is equal to the function evaluated at the rectangle’s right \(x\) coordinate. We call such a sum a right-sided Riemann sum. For this particular function, this right-sided sum leads to some significant over estimation.
If instead we defined our sum to be
the picture becomes
The left-sided estimate has negative signed error here: the estimate misses area under the curve on each interval.
Here, the rectangle height is based on the function evaluated at its left side, making this a left-sided Riemann sum. Just as the right-sided sum overestimates the integral, the left-sided sum underestimates the integral.
Exercise: Given the points \(x = [0, 2/3, 4/3, 2]\) and corresponding values \(y = [1, 3/5, 3/7, 1/3]\), estimate \(\int^2_0 y(x)dx\) using the right-sided sum and left-sided sum. What is the true value (assuming \(y = (x+1)^{-1}\))?
Exercise: Consider the following two columns of data:
\(x\) |
\(\sqrt{x}\) |
|---|---|
0.0000 |
0.0000 |
0.3333 |
0.5774 |
1.0000 |
1.0000 |
1.5000 |
1.2247 |
2.0000 |
1.4142 |
Estimate \(\int^2_0 f(x) dx\) using the right-sided sum and left-sided sum. Note that the \(x\) points are not evenly spaced.
Beyond the One-Side Sums
Can we do better? Remember, I said that the forward, backward, and central finite-difference approximations have analogous Riemann sums. Here, take the right- and left-sided sums to be like the forward and backward differences. If you hadn’t noticed, the central difference is nothing but an average of the forward and backward differences:
so we might expect something similar for the Riemann sums. There are two possibilities. First, we can evaluate the rectangle heights at the average value of its \(x\) coordinates, i.e.,
for which the picture becomes
The midpoint estimate mixes small positive and negative error regions. For this smooth curve, those regions cancel much more effectively.
This method is often called the midpoint rule, and it’s probably my favorite integration scheme because it’s pretty accurate and dirt simple to implement.
The alternative is to average the right- and left-sided sums, which leads to
If you consider this carefully, the resulting geometric picture turns rectangles into trapezoids (because the average of the area of two rectangles of heights \(y(x_1)\) and \(y(x_2)\) that share the same \(x\) coordinates \(x_1\) and \(x_2\) is equal to the area of the trapezoid whose coordinates include \((x_1, y_1)\) and \((x_2, y_2)\)), and the method is known as the trapezoid rule. (It’s those pesky end-point terms \((a)\) and \(f(b)\) that make this rule just a hair less convenient to apply in some cases, so I always stick to the midpoint rule when I can!)
The trapezoid estimate uses a straight-line segment across each interval. The colored regions show where that line differs from the curve.
For a function \(f(x)\) with sufficiently nice properties (beyond our scope), it’s not too difficult to estimate the error associated with these integrals as \(\Delta = (b-a)/n\) goes to zero (or equivalently, \(n \to \infty\). However, I’ll skip giving away the answers and let you determine these properties by numerical experiments in the homework!
Finally, the integration rules just explored represent the simplest possible Newton-Cotes formulas. The basic idea of Newton-Cotes integration is that a function \(f(x)\) is assumed to be piece-wise polynomial in finite ranges and evaluated at evenly-spaced points \(x_i\). Left-sided sums, right-sided sums, and and the midpoint rule take \(f(x)\) to be constant between adjacent points \(x_i\) and \(x_{i+1}\), while the trapezoid rule assumes \(f(x)\) is linear between adjacent points. If \(f(x)\) is assumed to be quadratic between \(x_i\) and \(x_{i+2}\), the result is Simpson’s rule (another favorite of mine).
Library Tools for Sampled Data
The rules above are simple enough that you should be able to implement them yourself. That is still important: if you cannot write a trapezoid rule in a few lines, then the library function is just a magic word.
Once the idea is clear, though, use the library routine. For data that have already been sampled at points x, the most common tools are
scipy.integrate.trapezoid(y, x)for the trapezoid rule,scipy.integrate.simpson(y, x=x)for Simpson’s rule, andscipy.integrate.cumulative_trapezoid(y, x, initial=0.0)when you want the accumulated integral as a function of position or time.
This is a different situation from integrating a function like np.exp over [0,1]. Here, the data are already on the page. The job is to integrate those samples without pretending we know more about the function than the data actually tell us.
[5]:
import numpy as np
from scipy.integrate import cumulative_trapezoid, simpson, trapezoid

x = np.array([0.0000, 0.3333, 1.0000, 1.5000, 2.0000])
y = np.sqrt(x)

I_trap = trapezoid(y, x)
I_simp = simpson(y, x=x)
I_cumulative = cumulative_trapezoid(y, x, initial=0.0)
I_ref = (2/3)*2**(3/2)

print(f"trapezoid  = {I_trap:.6f}")
print(f"simpson    = {I_simp:.6f}")
print(f"reference  = {I_ref:.6f}")
print(I_cumulative)
trapezoid  = 1.837937
simpson    = 1.901891
reference  = 1.885618
[0.         0.09621061 0.6220107  1.17819692 1.83793653]
The cumulative result is often more useful than the final number. For example, if the data were an acceleration history, the cumulative integral would give velocity history; a second cumulative integral would give displacement history. In NE language, the same habit shows up whenever a local quantity has to be accumulated into a total response.
Exercise: Suppose you accessed your fancy phone’s accelerometer log and extracted the following accelerations (in m/s\(^2\)) and times (in s):
a = 0, 0.1, 0.3, -0.2, 0.1
t = 2, 4, 6, 8, 10
Estimate how far you went in those 8 seconds using the trapezoid rule.
Exercise: Recall that the incremental work \(\delta W\) done by an expanding gas is given by \(\delta W = p \delta V\), where \(p\) is pressure and \(\delta V\) is the change in volume. Consider the following table of measured pressures (MPa) for several volumes (cm 3) during the expansion of the gas within an internal combustion engine.
\(p\) |
\(V\) |
|---|---|
15.6835 |
79.8508 |
12.7127 |
88.6913 |
9.3703 |
103.3057 |
6.5612 |
123.4549 |
4.5031 |
149.0202 |
2.0138 |
222.8411 |
Estimate the work performed by the gas using the trapezoid rule.
Exercise: Revisit the last exercise by determinging the \(n\) that satisfies \(pV^n = c\) for some constant \(c\). Then, using the same measured data, apply the midpoint rule to estimate the work done by the gas.
What About Accuracy?
As was done for the finite-difference methods, it is possible to determine the order of various numerical integration rules. The basic idea is to observe the (absolute) error between an exact, reference value for an integral and the approximation of that integral for various step sizes \(\Delta\).
The black points show the right-sided error for a smooth test function. The purple points show a second, less smooth comparison case; the reference lines give first- and second-order visual guides.
Exercise: Determine whether the right-sided sum is first order or second order using the definite integral \(\int^1_0 e^x dx = e - 1\) as a test case.
Solution:
[7]:
import numpy as np
import matplotlib.pyplot as plt

def right_sided_sum(f, a, b, n):
    """Approximate the integral of f over [a, b] using
       the right-sided sum and n evenly spaced points."""
    x = np.linspace(a, b, n+1)[1:]
    return np.sum(f(x))*(x[1]-x[0])

# reference integral value
I_ref = np.exp(1) - 1.0
# number of points to use in each sum
n_vals = 2**np.arange(1, 10)
# initialize the approximate integrals
I_appx = np.zeros(len(n_vals))
for i in range(len(n_vals)):
    I_appx[i] = right_sided_sum(np.exp, 0, 1, n_vals[i])
# absolute error
I_err = abs(I_appx-I_ref)
# Delta = (b-a)/(n+1)
Delta = 1/(n_vals+1)
# Plot the error along with linear and quadratic forms
plt.loglog(Delta, I_err, 'k', label='error')
plt.loglog(Delta, Delta, 'r--', label='$\mathcal{O}(\Delta)$')
plt.loglog(Delta, 10*Delta**2, 'b-.', label='$\mathcal{O}(\Delta^2)$')
plt.xlabel('$\Delta$')
plt.legend()
plt.show()
<>:24: SyntaxWarning: invalid escape sequence '\m'
<>:25: SyntaxWarning: invalid escape sequence '\m'
<>:26: SyntaxWarning: invalid escape sequence '\D'
<>:24: SyntaxWarning: invalid escape sequence '\m'
<>:25: SyntaxWarning: invalid escape sequence '\m'
<>:26: SyntaxWarning: invalid escape sequence '\D'
/tmp/ipykernel_143228/2207420918.py:24: SyntaxWarning: invalid escape sequence '\m'
  plt.loglog(Delta, Delta, 'r--', label='$\mathcal{O}(\Delta)$')
/tmp/ipykernel_143228/2207420918.py:25: SyntaxWarning: invalid escape sequence '\m'
  plt.loglog(Delta, 10*Delta**2, 'b-.', label='$\mathcal{O}(\Delta^2)$')
/tmp/ipykernel_143228/2207420918.py:26: SyntaxWarning: invalid escape sequence '\D'
  plt.xlabel('$\Delta$')
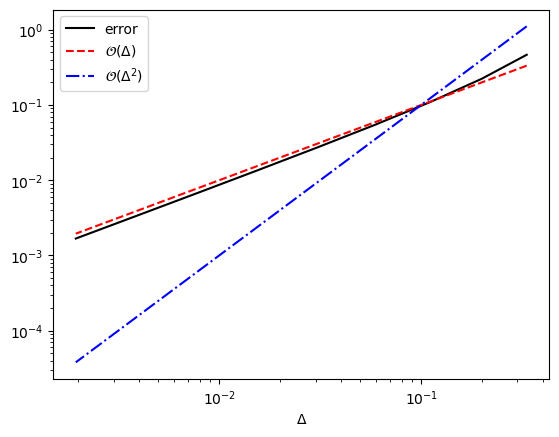
Surely, the error is much closer to the \(\mathcal{O}(\Delta)\) term and, hence, the right-sided sum is first order.
Exercise: Determine the order of the left-sided sum, midpoint rule, and trapezoid rule. You may use the definite integral \(\int^1_0 e^x dx = e - 1\) as a test case.
Using quad for Callable Functions
The previous section started with samples. A different problem is: “I have a function I can evaluate anywhere, and I want the integral.” That is when quad is usually the first SciPy tool to try.
SciPy is a large collection of open-source, Python tools for numerical and other scientific computing. For example, NumPy is a major component of SciPy but is often used as a standalone package (as are Matplotlib and SymPy). The scipy.integrate module contains several integration routines, but quad is the workhorse for one-dimensional integrals of callable functions.
[8]:
from scipy.integrate import quad

I_quad, err_quad = quad(np.exp, 0.0, 1.0)
I_ref = np.exp(1.0) - 1.0

print(f"quad result     = {I_quad:.16f}")
print(f"estimated error = {err_quad:.2e}")
print(f"true error      = {abs(I_quad - I_ref):.2e}")
quad result     = 1.7182818284590453
estimated error = 1.91e-14
true error      = 2.22e-16
By default, quad returns both the approximate integral and an estimated absolute error. Here, that error is ridiculously small (close to machine precision). For many smooth one-dimensional problems, that’s all one needs to do in order to compute an integral.
That does not mean quad is magic. Under the hood, quad calls routines from QUADPACK. For ordinary finite intervals, the method adaptively subdivides the interval and applies Gauss-Kronrod-style quadrature rules on the subintervals. It keeps subdividing until the estimated error satisfies tolerances such as epsabs and epsrel, or until it runs into a subdivision limit.
A few practical rules help:
Use
quadfor callable functions, not for data that are already sampled.If the integrand has a jump, cusp, singularity, or known trouble spot, split the integral or use the
pointsargument.Infinite intervals are allowed; internally, they are transformed to finite intervals.
The returned error is an estimate, not a proof. A physical or graphical sanity check is still your job.
[9]:
# A known internal point can help quad spend effort in the right place.
# This toy function is continuous, but it has a sharp change in slope at x=0.4.
def peaked(x):
    return np.exp(-20*abs(x - 0.4))

I_plain, err_plain = quad(peaked, 0.0, 1.0)
I_hint, err_hint = quad(peaked, 0.0, 1.0, points=[0.4])

print(I_plain, err_plain)
print(I_hint, err_hint)
0.09998291963330941 1.1161971513740099e-08
0.09998291965798728 1.15733619018813e-13
Multiple Integrals and Vector-Valued Integrands
Other SciPy integration functions are useful when the geometry gets more interesting:
dblquadcomputes a double integral with inner limits that may depend on the outer variable.nquadgeneralizes the same idea to more variables.quad_vecis useful when the integrand returns a vector rather than a scalar.
The argument order for dblquad is easy to trip over: the integrand is written as f(y, x), with the inner variable first.
[10]:
from scipy.integrate import dblquad

# Current balance example: if J(x,y) = (x, 2y), then div J = 3.
# The net current into the unit disk is -int_D div(J) dA = -3*pi.
def minus_divergence(y, x):
    return -3.0

J_in, err = dblquad(
    minus_divergence,
    -1.0, 1.0,
    lambda x: -np.sqrt(1.0 - x**2),
    lambda x:  np.sqrt(1.0 - x**2),
)

print(f"J_in = {J_in:.8f}")
print(f"-3*pi = {-3*np.pi:.8f}")
print(f"estimated error = {err:.2e}")
J_in = -9.42477796
-3*pi = -9.42477796
estimated error = 6.00e-09
This is the same accounting idea that shows up in transport: local rates are useful, but many engineering answers are totals over a region, a surface, an energy interval, or a time interval.
Numerical Probability Accounting
Numerical integration is often the step between a local model and a quantity we can check. The example below is deliberately self-contained: a particle starts uniformly in a cell of width \(h\), and an event occurs along distance with rate \(\beta\). If the particle starts at position \(x\), the probability of reaching the left face before the event is \(e^{-\beta x}\), and the probability of reaching the right face before the event is \(e^{-\beta(h-x)}\).
For an isotropic initial direction, the two face probabilities are
The complementary event probability is
A good numerical habit is to carry the denominator in words even when the result is dimensionless:
P_L  [left-face crossings / particle born in the cell]
P_R  [right-face crossings / particle born in the cell]
P_C  [events before face crossing / particle born in the cell]
The accounting check is \(P_L+P_R+P_C=1\).
[ ]:
import numpy as np
from scipy.integrate import quad


def face_probabilities_quad(beta, h):
    """Return left, right, and collision/event probabilities by quadrature."""
    left_integrand = lambda x: 0.5*np.exp(-beta*x)
    right_integrand = lambda x: 0.5*np.exp(-beta*(h - x))

    P_left, err_left = quad(left_integrand, 0.0, h)
    P_right, err_right = quad(right_integrand, 0.0, h)

    P_left /= h
    P_right /= h
    P_event = 1.0 - P_left - P_right
    err = (err_left + err_right)/h
    return P_left, P_right, P_event, err


def face_probability_closed(beta, h):
    """Closed-form one-face probability for beta*h not too small."""
    tau = beta*h
    if tau == 0.0:
        return 0.5
    return 0.5*(1.0 - np.exp(-tau))/tau


for tau in [0.01, 0.1, 1.0, 10.0]:
    beta = tau
    h = 1.0
    P_left, P_right, P_event, err = face_probabilities_quad(beta, h)
    P_face = face_probability_closed(beta, h)
    print(
        f"tau={tau:5.2f}  "
        f"P_left={P_left:.6f}  P_right={P_right:.6f}  "
        f"P_event={P_event:.6f}  sum={P_left + P_right + P_event:.12f}  "
        f"closed_face={P_face:.6f}"
    )
The same integral can be evaluated with a fixed quadrature rule. This is useful when you want full control over the points and weights or when the same rule will be reused many times.
For Gauss-Legendre quadrature, NumPy gives points and weights on \([-1,1]\). To integrate over \([0,1]\), map
Then
[ ]:
from numpy.polynomial.legendre import leggauss


def unit_gauss_legendre(n):
    """Gauss-Legendre points and weights mapped to [0, 1]."""
    z, w = leggauss(n)
    eta = 0.5*(z + 1.0)
    weights = 0.5*w
    return eta, weights


def face_probability_fixed_quad(beta, h, n):
    """One-face probability using an n-point rule on eta in [0, 1]."""
    eta, weights = unit_gauss_legendre(n)
    values = 0.5*np.exp(-beta*h*eta)
    return np.sum(weights*values)


beta = 3.0
h = 0.7
exact = face_probability_closed(beta, h)

print(f"closed form = {exact:.14f}")
for n in [1, 2, 3, 4, 8, 16]:
    approx = face_probability_fixed_quad(beta, h, n)
    print(f"n={n:2d}  approx={approx:.14f}  abs_error={abs(approx - exact):.2e}")

eta, weights = unit_gauss_legendre(4)
print(f"weight sum check = {weights.sum():.16f}")
Further Reading
The SciPy documentation for
scipy.integrateis the best practical reference for the current API.The
quaddocumentation is worth reading once, especially the notes about QUADPACK routines, tolerances,points, and infinite intervals.The sampled-data tools to remember are
trapezoid,simpson, andcumulative_trapezoid. Older names such astrapz,simps, andcumtrapzshould not be used in new SciPy code.